Visualisation: Distinguishing Phases
Styling by phase is largely achieved with color, here using the
phase_color() function, which will return
unique colors for each phase:
from pyrolite_meltsutil.vis.style import phase_color

phase_color("olivine")
'green'
This will also work if given a phase ID:
phase_color("olivine_0")
'green'
Similarly, to differentiate between different generations or endmembers,
a linestyle or marker can be used, here generated with
phaseID_linestyle() which takes the full phaseID:
from pyrolite_meltsutil.vis.style import phaseID_linestyle, phaseID_marker

[phaseID_linestyle(ol) for ol in ["olivine_0", "olivine_1", "olivine_2"]]
['-', '--', ':']
[phaseID_marker(ol) for ol in ["olivine_0", "olivine_1", "olivine_2"]]
['D', 's', 'o']
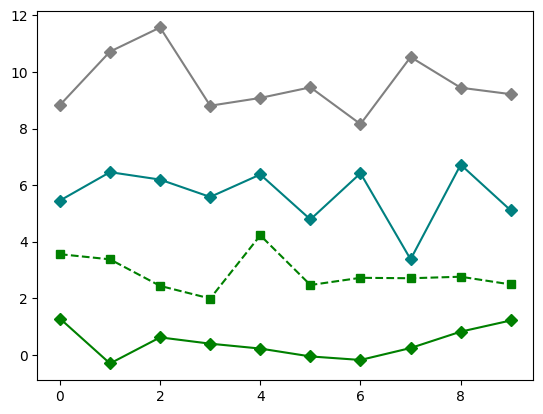
We can now use these when we’re plotting to differentiate different phases:
import numpy as np
import matplotlib.pyplot as plt
from pyrolite.util.plot.legend import proxy_line

np.random.seed(27)

fig, ax = plt.subplots(1)

for ix, (ID, style) in enumerate(zip(phaseIDs, styles)):
    ax.plot(np.arange(10), np.random.randn(10) + ix * 3, **style)
These are also handy for generating legend proxies, which can be used to generate summary legends where you may have multiple items with the same style:
proxies = [proxy_line(**sty) for sty in styles]
for ix, (ID, style) in enumerate(zip(phaseIDs, styles)):
    for i in range(3):  # make a few more lines per phaseID
        ax.plot(np.arange(10), np.random.randn(10) + ix * 3, **style)

ax.legend(  # use our proxy lines to generate a legend
    proxies,
    phaseIDs,
    frameon=False,
    facecolor=None,
    bbox_to_anchor=(1.0, 1.0),
    loc="upper left",
)
plt.show()

Total running time of the script: (0 minutes 0.332 seconds)