Visualisation: Plot Templates
pyrolite-meltsutil includes a few plot templates to quickly visualise some melts experiment results.
First let’s get a folder with some data in it. Here we use one of the isobaric crystallisation experiments from the montecarlo tutorial, and import the tables:
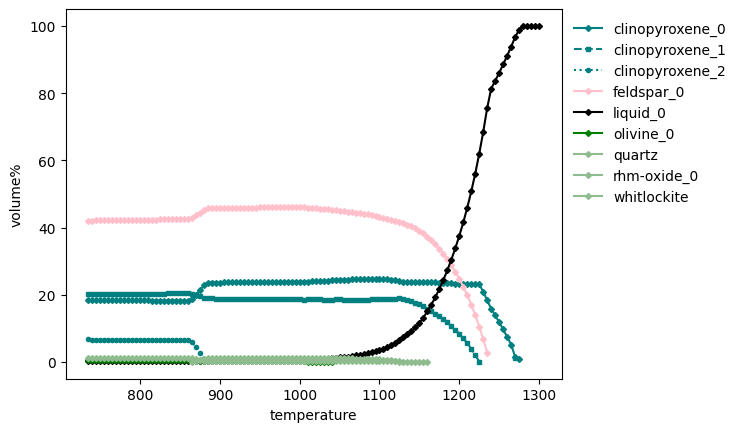
We can quickly visualise the phase volume relationships versus temperature:
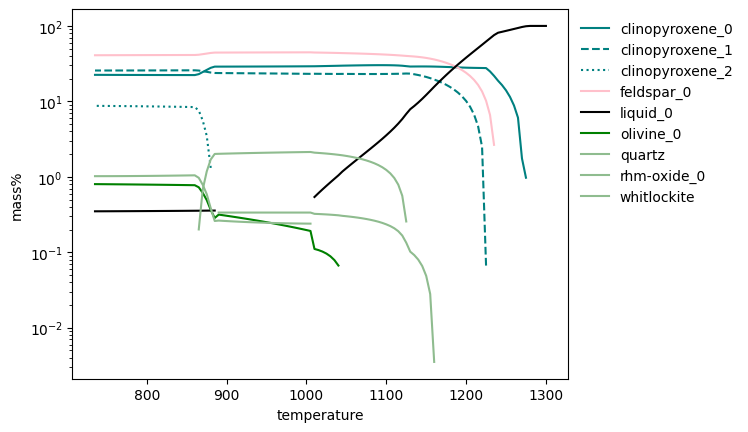
Similarly, for the phase mass relationships versus temperature:
from pyrolite_meltsutil.vis.templates import plot_phasemasses

ax, proxies = plot_phasemasses(phases, marker=None)
ax.set_yscale("log")
plt.show()
Total running time of the script: (0 minutes 2.363 seconds)